Exploring Neural Networks with Activation Atlases
March 6, 2019
Posted by Shan Carter, Software Engineer, Google AI
Quick links
Neural networks have become the de facto standard for image-related tasks in computing, currently being deployed in a multitude of scenarios, ranging from automatically tagging photos in your image library to autonomous driving systems. These machine-learned systems have become ubiquitous because they perform more accurately than any system humans were able to directly design without machine learning. But because essential details of these systems are learned during the automated training process, understanding how a network goes about its given task can sometimes remain a bit of a mystery.
Today, in collaboration with colleagues at OpenAI, we're publishing "Exploring Neural Networks with Activation Atlases", which describes a new technique aimed at helping to answer the question of what image classification neural networks "see" when provided an image. Activation atlases provide a new way to peer into convolutional vision networks, giving a global, hierarchical, and human-interpretable overview of concepts within the hidden layers of a network. We think of activation atlases as revealing a machine-learned alphabet for images — an array of simple, atomic concepts that are combined and recombined to form much more complex visual ideas. We are also releasing some jupyter notebooks to help you get you started in making your own activation atlases.
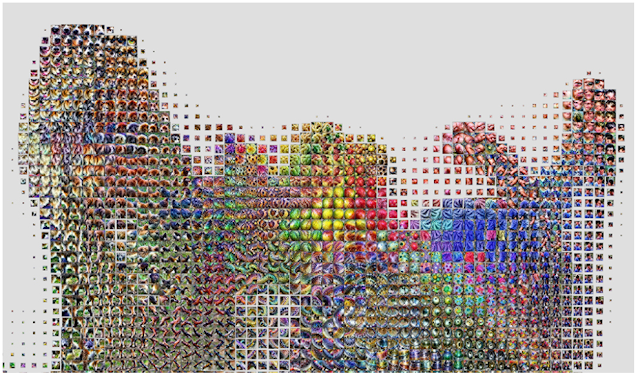
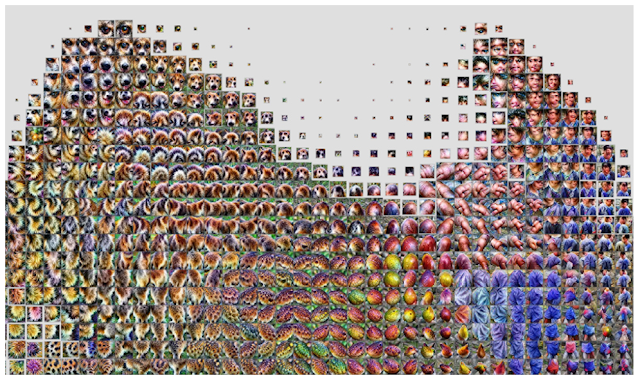
| A detail view of an activation atlas from one of the layers of the InceptionV1 vision classification network. It reveals many of the visual detectors that the network uses to classify images, such as different types of fruit-like textures, honeycomb patterns and fabric-like textures. |
The activation atlases shown below are built from a convolutional image classification network, Inceptionv1, that was trained on the ImageNet dataset. In general, classification networks are shown an image and then asked to give that image a label from one of 1,000 predetermined classes — such as "carbonara", "snorkel" or "frying pan". To do this, our network evaluates the image data progressively through about ten layers, each made of hundreds of neurons that each activate to varying degrees on different types of image patches. One neuron at one layer might respond positively to a dog's ear, another at an earlier layer might respond to a high-contrast vertical line.
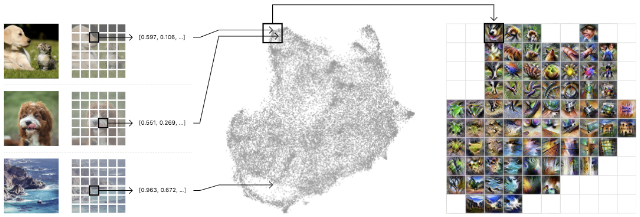
An activation atlas is built by collecting the internal activations from each of these layers of our neural network from one million images. These activations, represented by a complex set of high-dimensional vectors, is projected into useful 2D layouts via UMAP, a dimensionality-reduction technique that preserving some of the local structure of the original high-dimensional space.
This takes care of organizing our activation vectors, but we also need to aggregate them into a more manageable number — all the activations are too many to consume at a glance. To do this, we draw a grid over the 2D layout we created. For each cell in our grid, we average all the activations that lie within the boundaries of that cell, and use feature visualization to create an iconic representation.
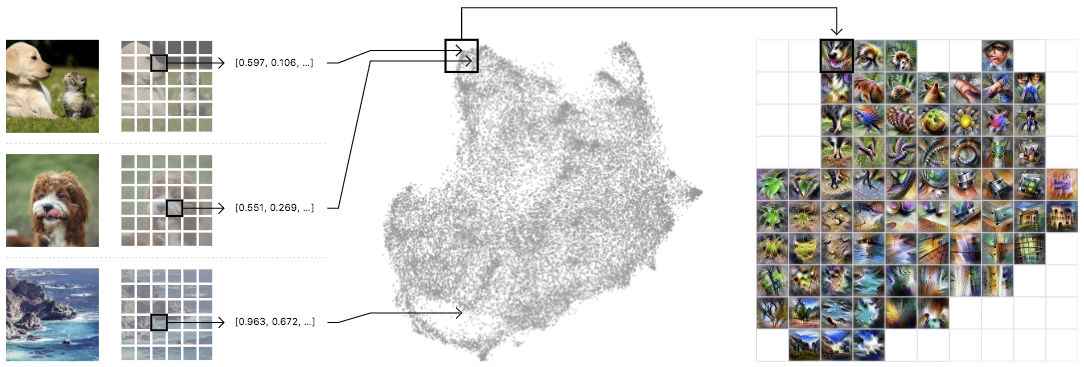 |
| Left: A randomized set of one million images is fed through the network, collecting one random spatial activation per image. Center: The activations are fed through UMAP to reduce them to two dimensions. They are then plotted, with similar activations placed near each other. Right: We then draw a grid, average the activations that fall within a cell, and run feature inversion on the averaged activation. |
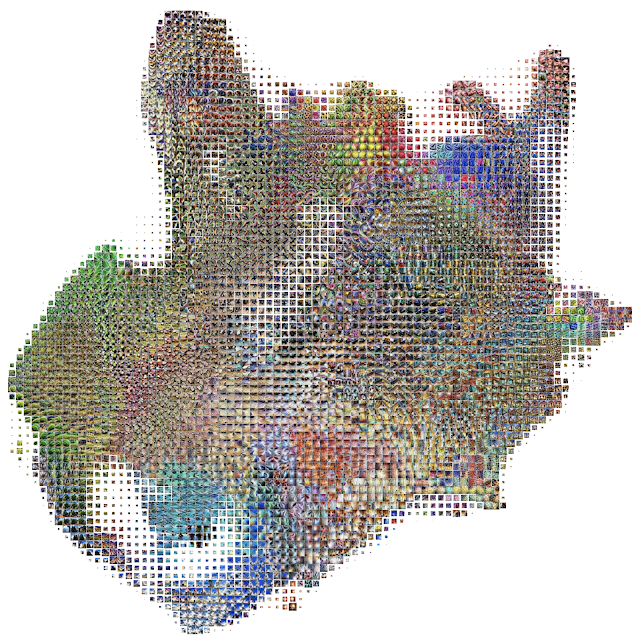
Below we can see an activation atlas for just one layer in a neural network (remember that these classification models can have half a dozen or more layers). It reveals a universe of the visual concepts the network has learned to classify images at this layer. This atlas can be a bit overwhelming at first glance — there's a lot going on! This diversity is a reflection of the variety of visual abstractions and concepts the model has developed.
 |
| An overview of an activation atlas for one of the many layers (mixed4c) within Inception v1. It is about halfway through the network. |
 |
| In this detail, we can see detectors for different types of leaves and plants. |
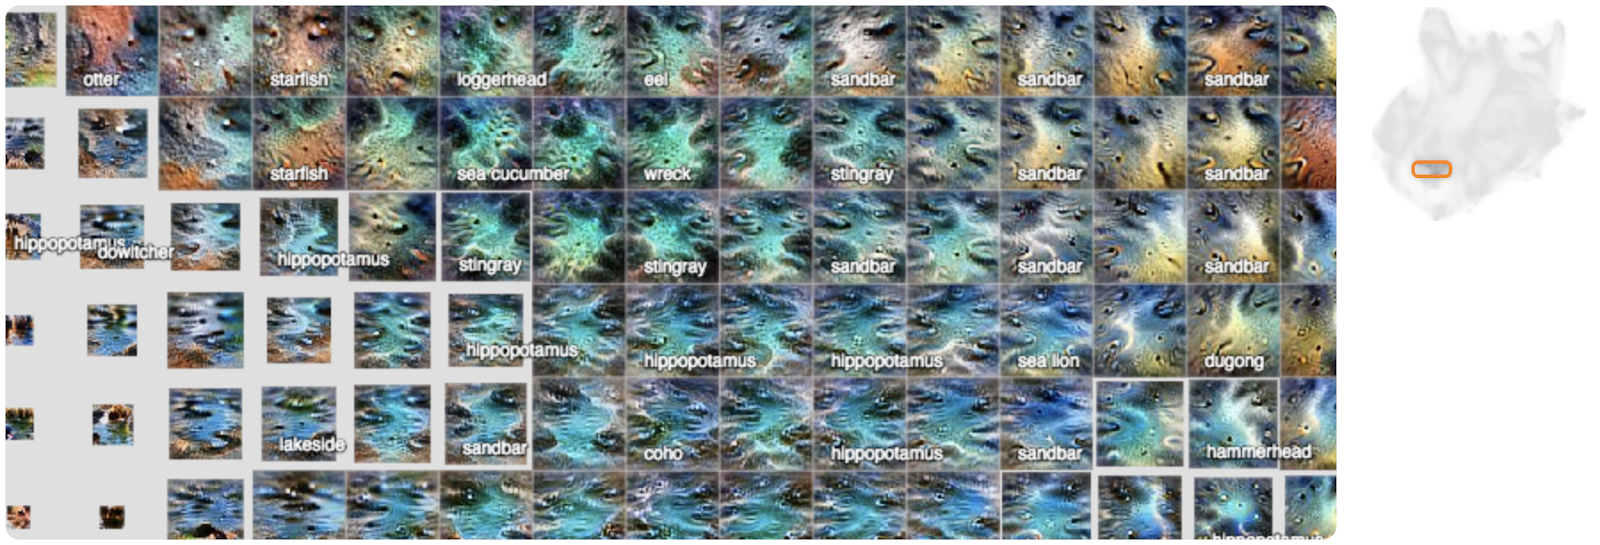 |
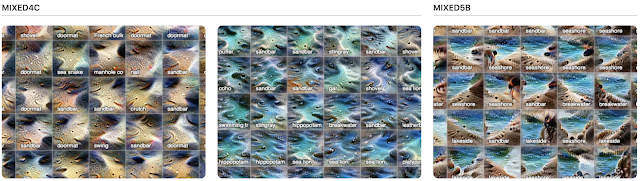
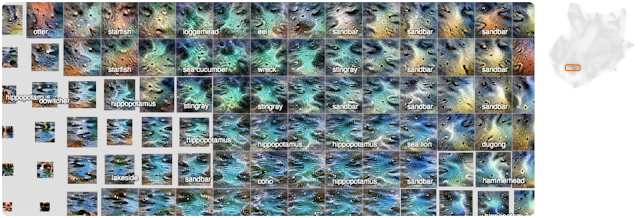
| Here we can see different detectors for water, lakes and sandbars. |
 |
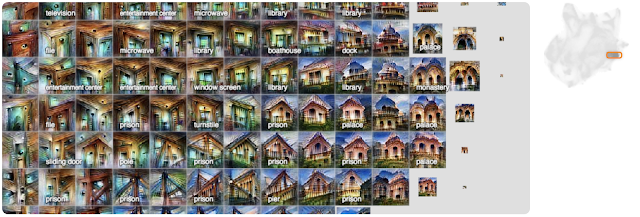
| Here we see different types of buildings and bridges. |
As we mentioned before, there are many more layers in this network. Let's look at the layers that came before this one to see how these concepts become more refined as we go deeper into the network (Each layer builds its activations on top of the preceding layer's activations).
 |
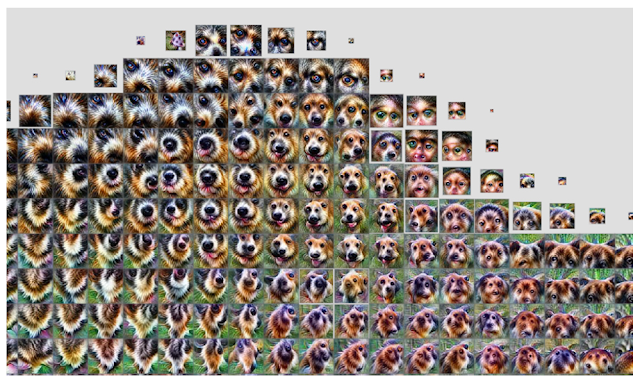
| In an early layer, mixed4a, there is a vague "mammalian" area. |
 |
| By the next layer in the network, mixed4b, animals and people have been disentangled, with some fruit and food emerging in the middle. |
 |
| By layer mixed4c these concepts are further refined and differentiated into small "peninsulas". |
Here we've seen the global structure evolve from layer to layer, but each of the individual concepts also become more specific and complex from layer to layer. If we focus on the areas of three layers that contribute to a specific classification, say "cabbage", we can see this clearly.
 |
| Left: This early layer is very nonspecific in comparison to the others. Center: By the middle layer, the images definitely resemble leaves, but they could be any type of plant. Right: By the last layer the images are very specific to cabbage, leaves curved into rounded balls. |
There is another phenomenon worth noting: not only are concepts being refined as you move from layer to layer, but new concepts seem to be appearing out of combinations of old ones.
 |
| You can see how sand and water are distinct concepts in a middle layer, mixed4c (left and center), both with strong attributions to the classification of "sandbar". Contrast this with a later layer (right), mixed5b, where the two ideas seem to be fused into one activation. |
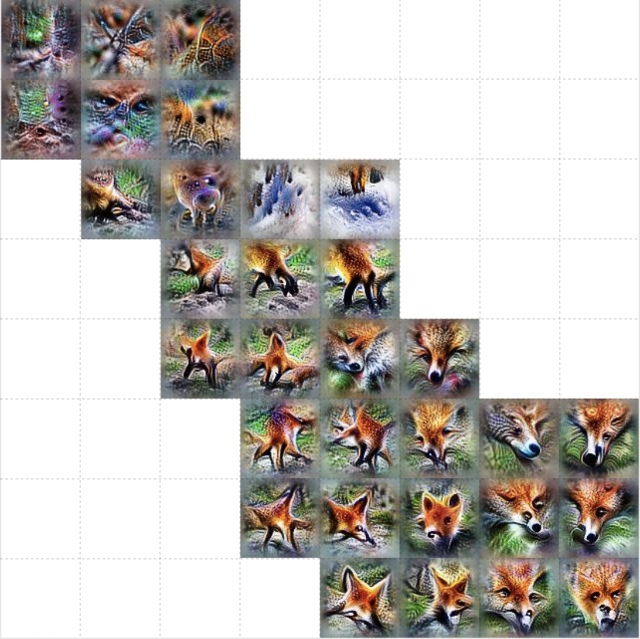
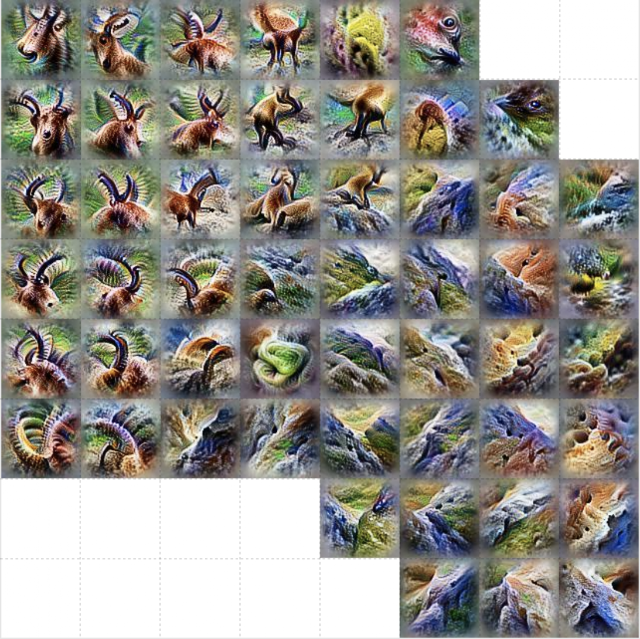
Instead of zooming in on certain areas of the whole atlas for a specific layer, we can also create an atlas at a specific layer for just one of the 1,000 classes in ImageNet. This will show the concepts and detectors that the network most often uses to classify a specific class, say "red fox" for instance.
 |
| Here we can more clearly see what the network is focusing on to classify a "red fox". There are pointy ears, white snouts surrounded by red fur, and wooded or snowy backgrounds. |
 |
| Here we can see the many different scales and angles of detectors for "tile roof". |
 |
| For "ibex", we see detectors for horns and brown fur, but also environments where we might find such animals, like rocky hillsides. |
 |
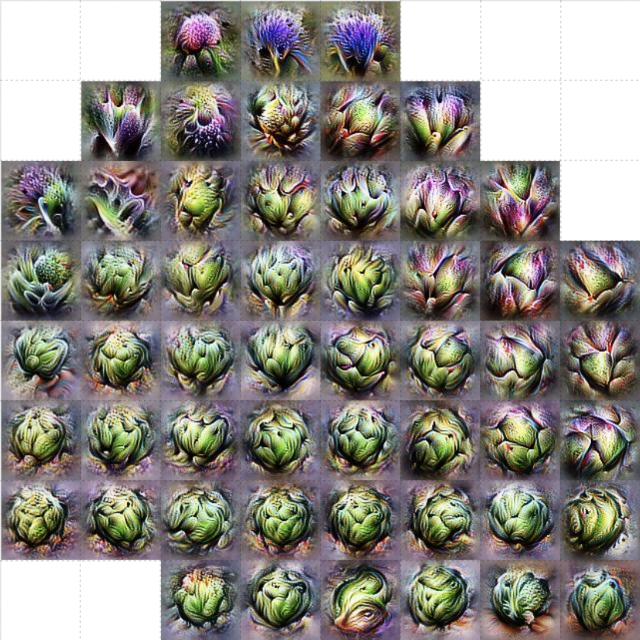
| Like the detectors for tile roof, "artichoke" also has many different sizes of detectors for the texture of an artichoke, but we also get some purple flower detectors. These are presumably detecting the blossoms of an artichoke plant. |
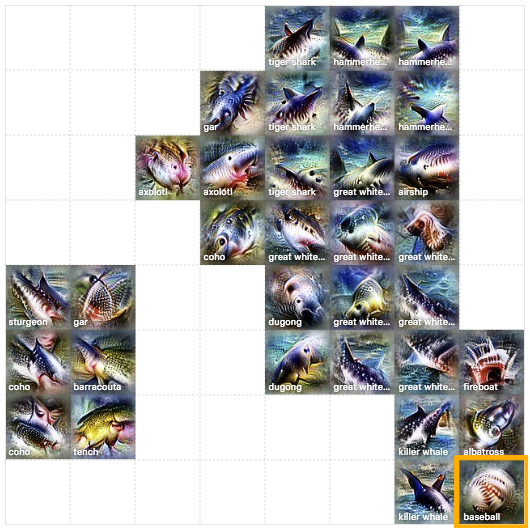
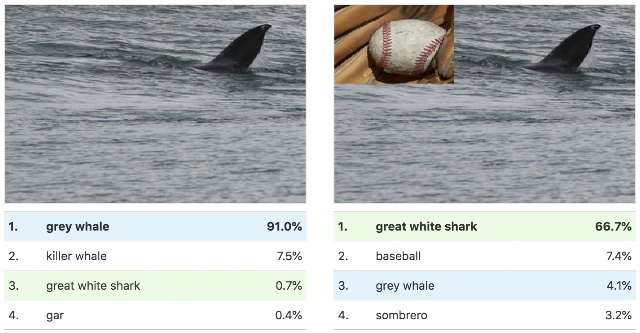
These atlases not only reveal nuanced visual abstractions within a model, but they can also reveal high-level misunderstandings. For example, by looking at an activation atlas for a "great white shark" we water and triangular fins (as expected) but we also see something that looks like a baseball. This hints at a shortcut taken by this research model where it conflates the red baseball stitching with the open mouth of a great white shark.

We can test this by using a patch of an image of a baseball to switch the model's classification of a particular image from "grey whale" to "great white shark".

We hope that activation atlases will be a useful tool in the quiver of techniques that are making machine learning more accessible and interpretable. To help you get started, we've released several jupyter notebooks which can be executed immediately in your browser with one click via colab. They build upon the previously released toolkit Lucid, which includes code for many other interpretability visualization techniques included as well. We're excited to see what you discover!
Quick links
Other posts of interest
-
February 17, 2026
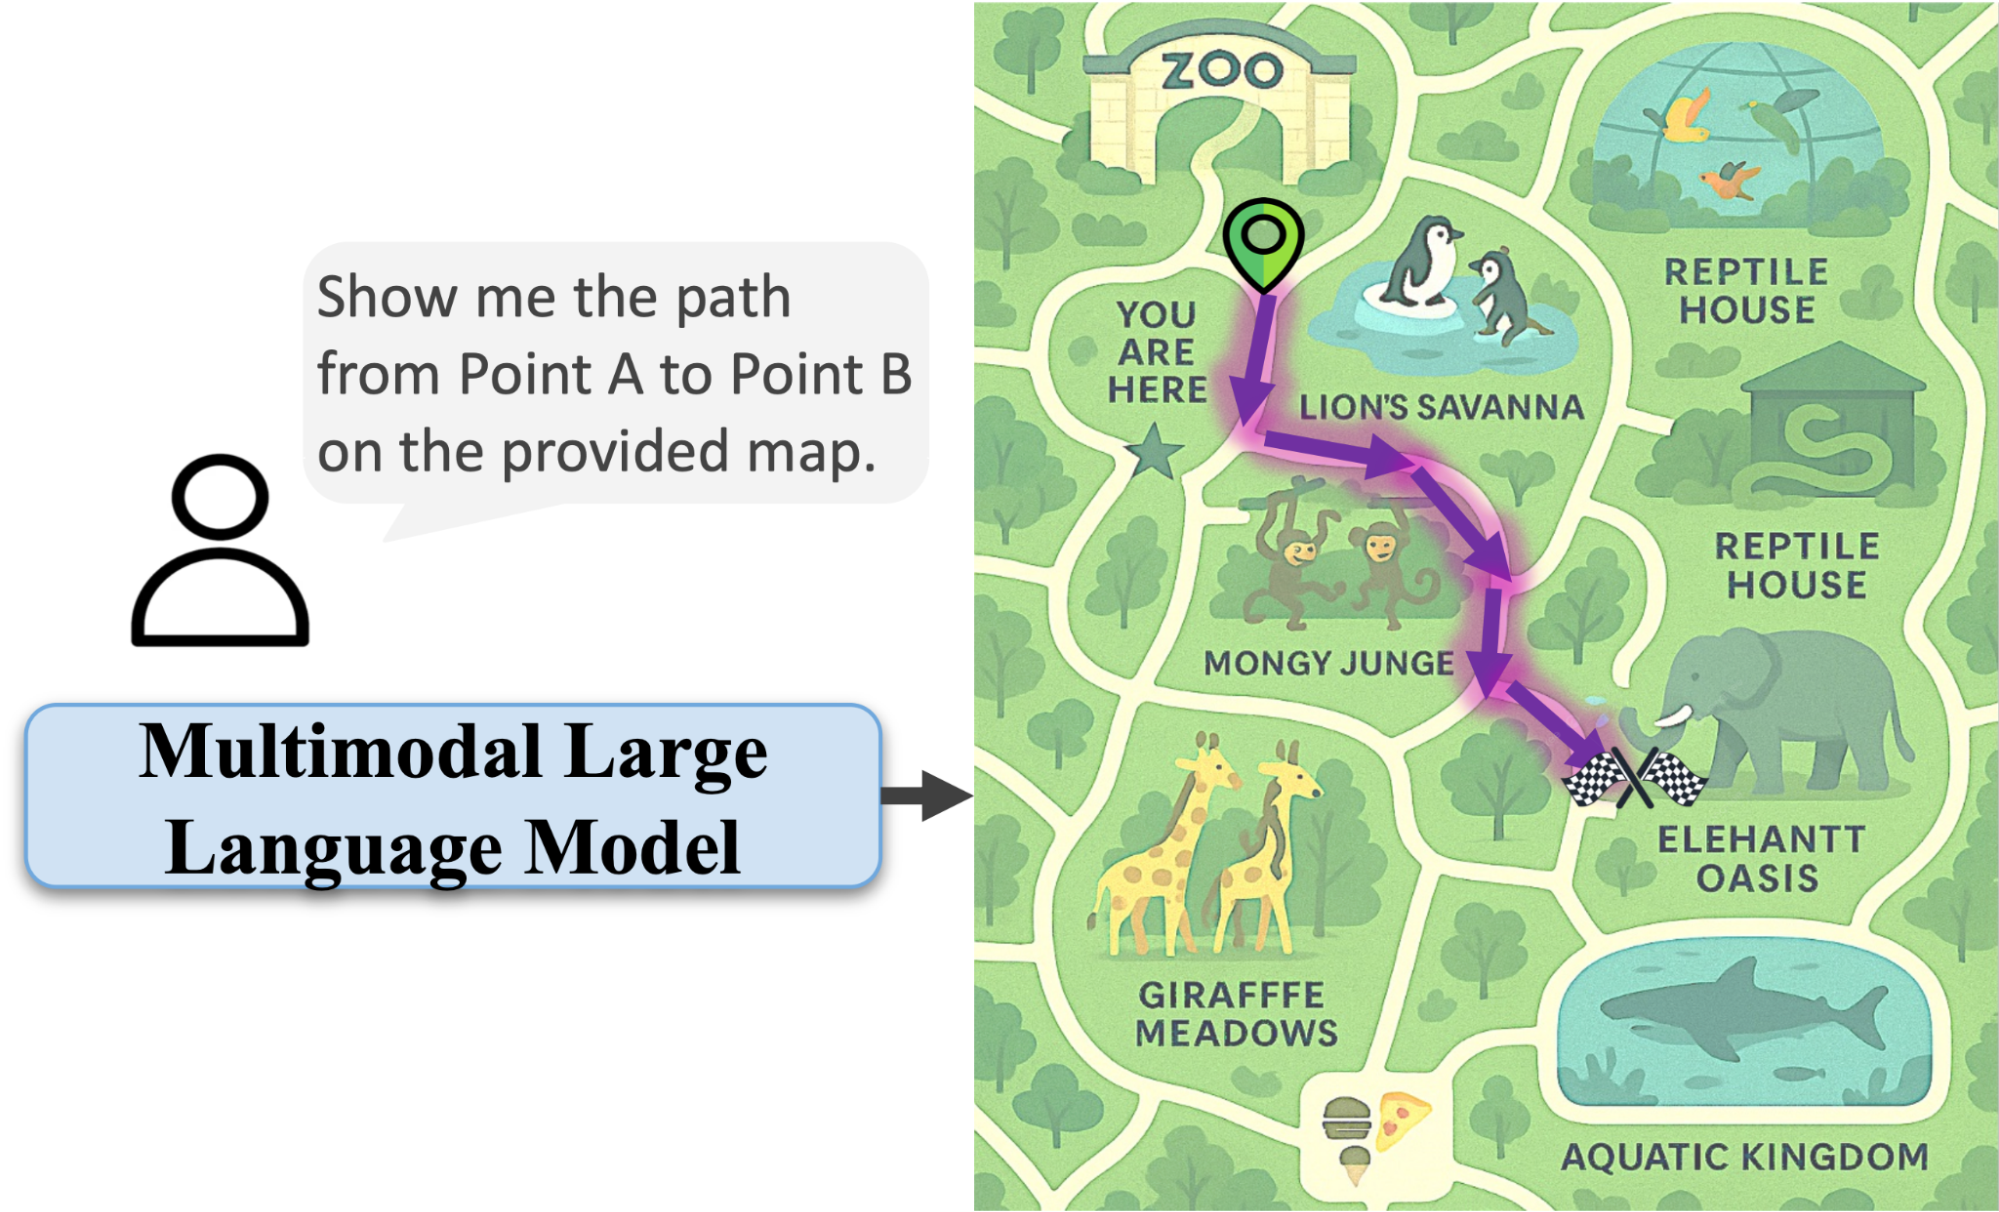
Teaching AI to read a map- Machine Perception ·
- Open Source Models & Datasets
-
January 22, 2026
Small models, big results: Achieving superior intent extraction through decomposition- Generative AI ·
- Machine Perception ·
- Mobile Systems
-

October 23, 2025
Google Earth AI: Unlocking geospatial insights with foundation models and cross-modal reasoning- Climate & Sustainability ·
- Earth AI ·
- Generative AI ·
- Machine Perception